はじめに
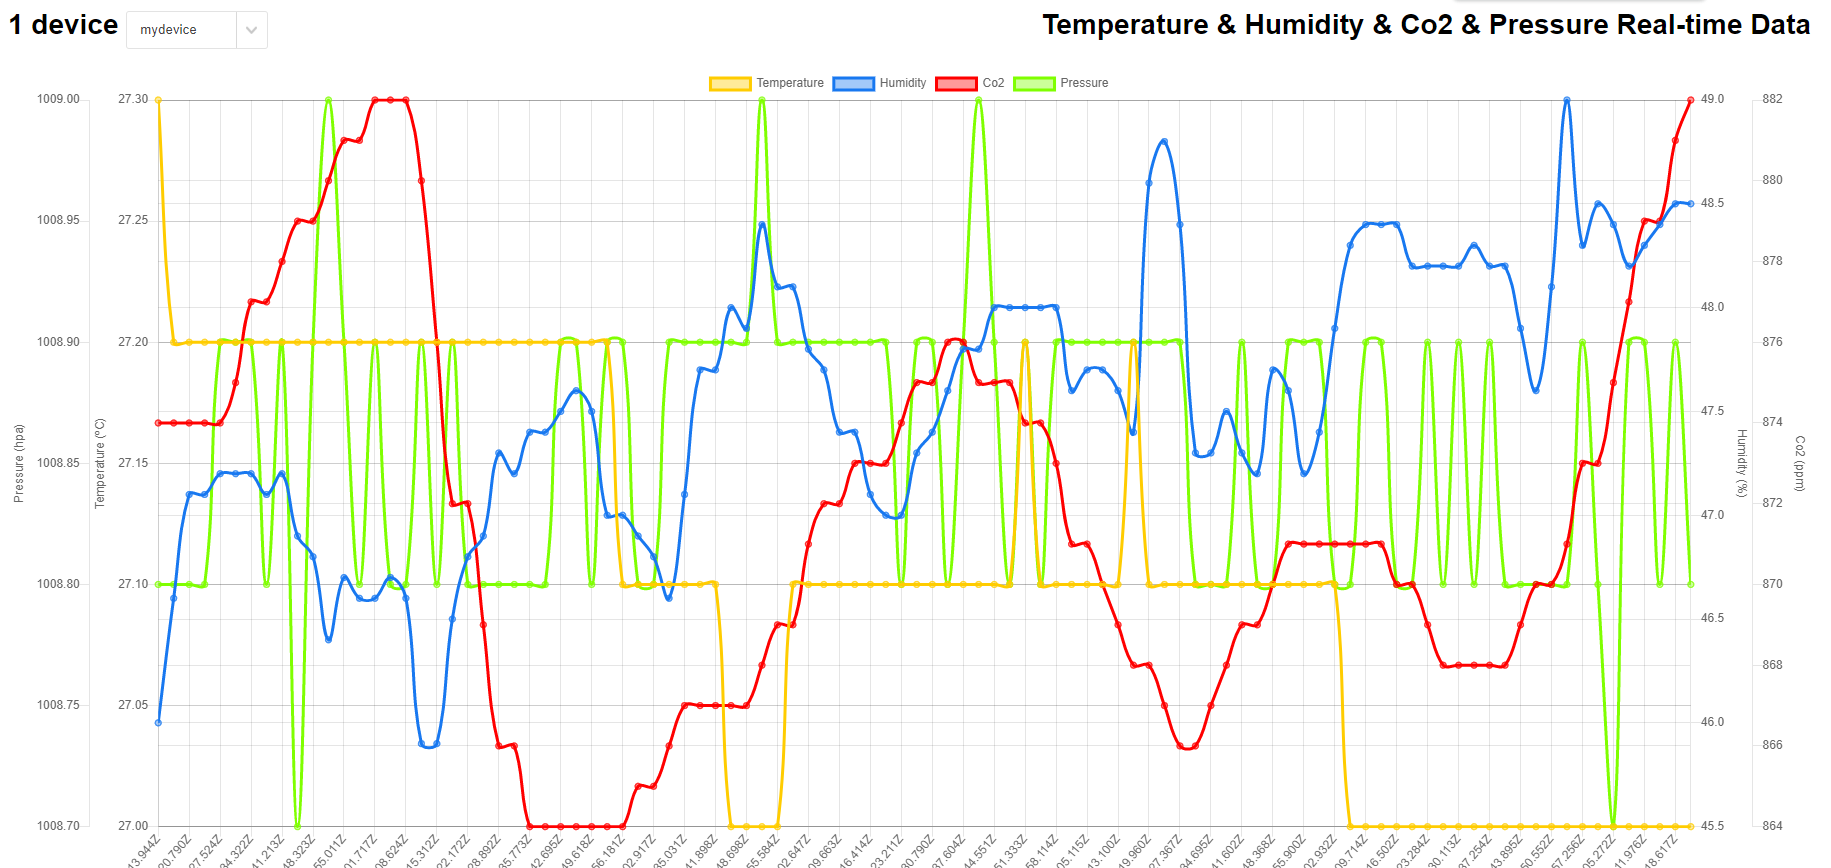
Rasberry Pi からAzure IoT Hub に送信したデータを可視化(温度、湿度、Co2、気圧)を取得します。
これは前回の続きです。温度、湿度だけだったサンプルにCo2、気圧を追加していきます。

RRasberry Pi
最初に前回使用したサンプルを編集し、送信するデータにCo2、気圧を追加します。

#coding: utf-8

IOTHUB_DEVICE_CONNECTION_STRING ="接続文字列を入力"
n=1
#---TFT-ili9341 init-----rgb_display_pillow_stats.py---
import time
import subprocess
import digitalio
import board
import mh_z19
import json

import os
import asyncio
from azure.iot.device.aio import IoTHubDeviceClient

from PIL import Image, ImageDraw, ImageFont
from adafruit_rgb_display import ili9341

# Configuration for CS and DC pins (these are PiTFT defaults):
cs_pin = digitalio.DigitalInOut(board.CE0)
dc_pin = digitalio.DigitalInOut(board.D25)
reset_pin = digitalio.DigitalInOut(board.D24)

# Config for display baudrate (default max is 24mhz):
BAUDRATE = 24000000

# Setup SPI bus using hardware SPI:
spi = board.SPI()

# pylint: disable=line-too-long
# Create the display:
disp = ili9341.ILI9341(
    spi,
    rotation=90,  # 2.2", 2.4", 2.8", 3.2" ILI9341
    cs=cs_pin,
    dc=dc_pin,
    rst=reset_pin,
    baudrate=BAUDRATE,
)
# pylint: enable=line-too-long
# Create blank image for drawing.
# Make sure to create image with mode 'RGB' for full color.
if disp.rotation % 180 == 90:
    height = disp.width  # we swap height/width to rotate it to landscape!
    width = disp.height
else:
    width = disp.width  # we swap height/width to rotate it to landscape!
    height = disp.height

image = Image.new("RGB", (width, height))

# Get drawing object to draw on image.
draw = ImageDraw.Draw(image)

# Draw a black filled box to clear the image.
draw.rectangle((0, 0, width, height), outline=0, fill=(0, 0, 0))
disp.image(image)

# First define some constants to allow easy positioning of text.
padding = -2
x = 0

# Load a ipaexfont-gothic font.
font1 = ImageFont.truetype("/usr/share/fonts/opentype/ipaexfont-gothic/ipaexg.ttf", 50)
font2 = ImageFont.truetype("/usr/share/fonts/opentype/ipaexfont-gothic/ipaexg.ttf", 20)
font3 = ImageFont.truetype("/usr/share/fonts/opentype/ipaexfont-gothic/ipaexg.ttf", 15)


#---BME280 init---------------bme280_sample.py------------
import smbus2
import bme280

port = 1
address = 0x76
bus = smbus2.SMBus(port)

calibration_params = bme280.load_calibration_params(bus, address)

# the sample method will take a single reading and return a
# compensated_reading object
data = bme280.sample(bus, address, calibration_params)

async def connect_iot():
    # Fetch the connection string from an environment variable
    conn_str =IOTHUB_DEVICE_CONNECTION_STRING

    # Create instance of the device client using the connection string
    device_client = IoTHubDeviceClient.create_from_connection_string(conn_str)

    # Connect the device client.
    await device_client.connect()

    # Send a single message
    print("Sending message...")
    sendmg = {'messageId':num,'deviceId':'Raspberry Pi Web Client','temperature':format(float(data.temperature), '.1f'),'humidity':format(float(data.humidity), '.1f'),'co2':format(float(outco2), '.1f'),'pressure':format(float(data.pressure), '.1f')}
    await device_client.send_message(json.dumps(sendmg))
    print("Message successfully sent!")

    # Finally, shut down the client
    await device_client.shutdown()

num = 0
while True:
        outco2 = mh_z19.read_co2valueonly()
        num = num + 1

        dtd = time.strftime('%Y年%m月%d日', time.localtime())
        dtt = time.strftime('%H時%M分%S秒', time.localtime())
        dta = time.strftime('%a', time.localtime())
        dta = time.strftime('%a', time.localtime())
        if dta == "Mon":
         jdta = dta.replace("Mon", "(月)")
        elif dta == "Tue":
         jdta = dta.replace("Tue", "(火)")
        elif dta == "Wed":
         jdta = dta.replace("Wed", "(水)")
        elif dta == "Thu":
         jdta = dta.replace("Thu", "(木)")
        elif dta == "Fri":
         jdta = dta.replace("Fri", "(金)")
        elif dta == "Sat":
         jdta = dta.replace("Sat", "(土)")
        elif dta == "Sun":
         jdta = dta.replace("Sun", "(日)")
        else:
         jdta="ー"

        data = bme280.sample(bus, address, calibration_params)
        pbme280 = f"{data.pressure:.1f},{data.temperature:.1f},{data.humidity:.1f}"

        #pscd30 = f"{m[0]:.1f},{m[1]:.1f},{m[2]:.1f}"
        pcsv = dtd + jdta + " " + dtt + "," + str(outco2) + "," + pbme280
        #print(pcsv)
        #print(pbme280)

        asyncio.run(connect_iot())

        # Draw a black filled box to clear the image.
        draw.rectangle((0, 0, width, height), outline=0, fill=(0, 0, 0))

        draw.text((50, 192), dtd, font=font2, fill="#00ff00")
        draw.text((50, 212), dtt, font=font2, fill="#00ff00")
        draw.text((220, 192), jdta, font=font2, fill="#00ff00")

        draw.text((20, 3), "温度:", font=font2, fill="#ffffff")
        draw.text((24, 25), "( ℃ )", font=font3, fill="#ffffff")
        temp =format(float(data.temperature), '.1f')
        draw.text((90, 0), temp, font=font1, fill="#ffffff")

        draw.text((14, 50), "CO   :", font=font2, fill="#FFFF00")
        draw.text((47, 58), "2", font=font3, fill="#FFFF00")
        draw.text((14, 70), "( ppm )", font=font3, fill="#FFFF00")
        co2 =format(float(outco2), '.1f')
        draw.text((90, 47), co2, font=font1, fill="#FFFF00")

        draw.text((20, 97), "気圧:", font=font2, fill="#ffffff")
        draw.text((18, 117), "( hpa )", font=font3, fill="#ffffff")
        pres =format(float(data.pressure), '.1f')
        draw.text((90, 93), pres, font=font1, fill="#ffffff")

        draw.text((20, 143), "湿度:", font=font2, fill="#ffffff")
        draw.text((24, 165), "( % )", font=font3, fill="#ffffff")
        humi =format(float(data.humidity), '.1f')
        draw.text((90, 140), humi, font=font1, fill="#ffffff")

        disp.image(image)
        time.sleep(2)
サンプル
サンプルも変えていきます。

public\js\chart-device-data.js を編集します。
/* eslint-disable max-classes-per-file */
/* eslint-disable no-restricted-globals */
/* eslint-disable no-undef */
$(document).ready(() => {
  // if deployed to a site supporting SSL, use wss://
  const protocol = document.location.protocol.startsWith('https') ? 'wss://' : 'ws://';
  const webSocket = new WebSocket(protocol + location.host);

  // A class for holding the last N points of telemetry for a device
  class DeviceData {
    constructor(deviceId) {
      this.deviceId = deviceId;
      this.maxLen = 100;
      this.timeData = new Array(this.maxLen);
      this.temperatureData = new Array(this.maxLen);
      this.humidityData = new Array(this.maxLen);
      this.co2Data = new Array(this.maxLen);
      this.pressureData = new Array(this.maxLen);
    }

    addData(time, temperature, humidity, co2, pressure) {
      this.timeData.push(time);
      this.temperatureData.push(temperature);
      this.humidityData.push(humidity || null);
      this.co2Data.push(co2 || null);
      this.pressureData.push(pressure || null);

      if (this.timeData.length > this.maxLen) {
        this.timeData.shift();
        this.temperatureData.shift();
        this.humidityData.shift();
        this.co2Data.shift();
        this.pressureData.shift();
      }
    }
  }

  // All the devices in the list (those that have been sending telemetry)
  class TrackedDevices {
    constructor() {
      this.devices = [];
    }

    // Find a device based on its Id
    findDevice(deviceId) {
      for (let i = 0; i < this.devices.length; ++i) {
        if (this.devices[i].deviceId === deviceId) {
          return this.devices[i];
        }
      }

      return undefined;
    }

    getDevicesCount() {
      return this.devices.length;
    }
  }

  const trackedDevices = new TrackedDevices();

  // Define the chart axes
  const chartData = {
    datasets: [
      {
        fill: false,
        label: 'Temperature',
        yAxisID: 'Temperature',
        borderColor: 'rgba(255, 204, 0, 1)',
        pointBoarderColor: 'rgba(255, 204, 0, 1)',
        backgroundColor: 'rgba(255, 204, 0, 0.4)',
        pointHoverBackgroundColor: 'rgba(255, 204, 0, 1)',
        pointHoverBorderColor: 'rgba(255, 204, 0, 1)',
        spanGaps: true,
      },
      {
        fill: false,
        label: 'Humidity',
        yAxisID: 'Humidity',
        borderColor: 'rgba(24, 120, 240, 1)',
        pointBoarderColor: 'rgba(24, 120, 240, 1)',
        backgroundColor: 'rgba(24, 120, 240, 0.4)',
        pointHoverBackgroundColor: 'rgba(24, 120, 240, 1)',
        pointHoverBorderColor: 'rgba(24, 120, 240, 1)',
        spanGaps: true,
      },
      {
        fill: false,
        label: 'Co2',
        yAxisID: 'Co2',
        borderColor: 'rgba(255, 0, 0, 1)',
        pointBoarderColor: 'rgba(255, 0, 0, 1)',
        backgroundColor: 'rgba(255, 0, 0, 0.4)',
        pointHoverBackgroundColor: 'rgba(255, 0, 0, 1)',
        pointHoverBorderColor: 'rgba(255, 0, 0, 1)',
        spanGaps: true,
      },
      {
        fill: false,
        label: 'Pressure',
        yAxisID: 'Pressure',
        borderColor: 'rgba(127, 255, 0, 1)',
        pointBoarderColor: 'rgba(127, 255, 0, 1)',
        backgroundColor: 'rgba(127, 255, 0, 0.4)',
        pointHoverBackgroundColor: 'rgba(127, 255, 0, 1)',
        pointHoverBorderColor: 'rgba(127, 255, 0, 1)',
        spanGaps: true,
      }
    ]
  };

  const chartOptions = {
    scales: {
      yAxes: [{
        id: 'Temperature',
        type: 'linear',
        scaleLabel: {
          labelString: 'Temperature (ºC)',
          display: true,
        },
        position: 'left',
      },
      {
        id: 'Humidity',
        type: 'linear',
        scaleLabel: {
          labelString: 'Humidity (%)',
          display: true,
        },
        position: 'right',
      },
      {
        id: 'Co2',
        type: 'linear',
        scaleLabel: {
          labelString: 'Co2 (ppm)',
          display: true,
        },
        position: 'right',
      },
      {
        id: 'Pressure',
        type: 'linear',
        scaleLabel: {
          labelString: 'Pressure (hpa)',
          display: true,
        },
        position: 'left',
      }]
    }
  };

  // Get the context of the canvas element we want to select
  const ctx = document.getElementById('iotChart').getContext('2d');
  const myLineChart = new Chart(
    ctx,
    {
      type: 'line',
      data: chartData,
      options: chartOptions,
    });

  // Manage a list of devices in the UI, and update which device data the chart is showing
  // based on selection
  let needsAutoSelect = true;
  const deviceCount = document.getElementById('deviceCount');
  const listOfDevices = document.getElementById('listOfDevices');
  function OnSelectionChange() {
    const device = trackedDevices.findDevice(listOfDevices[listOfDevices.selectedIndex].text);
    chartData.labels = device.timeData;
    chartData.datasets[0].data = device.temperatureData;
    chartData.datasets[1].data = device.humidityData;
    chartData.datasets[2].data = device.co2Data;
    chartData.datasets[3].data = device.pressureData;
    myLineChart.update();
  }
  listOfDevices.addEventListener('change', OnSelectionChange, false);

  // When a web socket message arrives:
  // 1. Unpack it
  // 2. Validate it has date/time and temperature
  // 3. Find or create a cached device to hold the telemetry data
  // 4. Append the telemetry data
  // 5. Update the chart UI
  webSocket.onmessage = function onMessage(message) {
    try {
      const messageData = JSON.parse(message.data);
      console.log(messageData);

      // time and either temperature or humidity are required
      if (!messageData.MessageDate || (!messageData.IotData.temperature && !messageData.IotData.humidity && !messageData.IotData.co2 && !messageData.IotData.pressure)) {
        return;
      }

      // find or add device to list of tracked devices
      const existingDeviceData = trackedDevices.findDevice(messageData.DeviceId);

      if (existingDeviceData) {
        existingDeviceData.addData(messageData.MessageDate, messageData.IotData.temperature, messageData.IotData.humidity, messageData.IotData.co2, messageData.IotData.pressure);
      } else {
        const newDeviceData = new DeviceData(messageData.DeviceId);
        trackedDevices.devices.push(newDeviceData);
        const numDevices = trackedDevices.getDevicesCount();
        deviceCount.innerText = numDevices === 1 ? `${numDevices} device` : `${numDevices} devices`;
        newDeviceData.addData(messageData.MessageDate, messageData.IotData.temperature, messageData.IotData.humidity, messageData.IotData.co2, messageData.IotData.pressure);

        // add device to the UI list
        const node = document.createElement('option');
        const nodeText = document.createTextNode(messageData.DeviceId);
        node.appendChild(nodeText);
        listOfDevices.appendChild(node);

        // if this is the first device being discovered, auto-select it
        if (needsAutoSelect) {
          needsAutoSelect = false;
          listOfDevices.selectedIndex = 0;
          OnSelectionChange();
        }
      }

      myLineChart.update();
    } catch (err) {
      console.error(err);
    }
  };
});
以上です。
まとめ
表示やスケールは少々雑です。サンプルを活用してここまでできます。App Serviceなどに実装するとどこからでも見れます。