はじめに
Azure仮想マシンでもPrometheusを活用できるという話題です。PrometheusはAzureとの連携が用意にできるような仕組みを持っています。
これは <azure_sd_config> を定義することでAzure上の仮想マシンを検出することが可能です。Azure discoveryです。

Auto discovery を利用するには以下の作業が必要となります。
- アプリ登録
- Prometheusのインストールとprometheus.yml に<azure_sd_config>を追加
- node_exporterのインストール
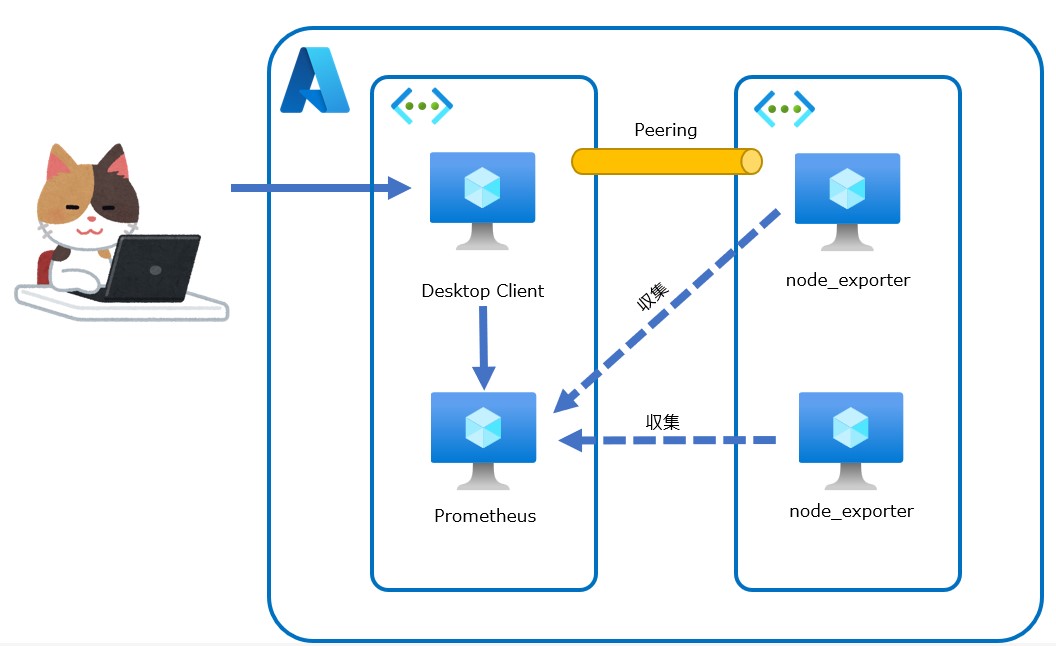
検証用の環境
Prometheus 用と監視する対象として2台を用意し、確認用にWindows serverを用意しています。
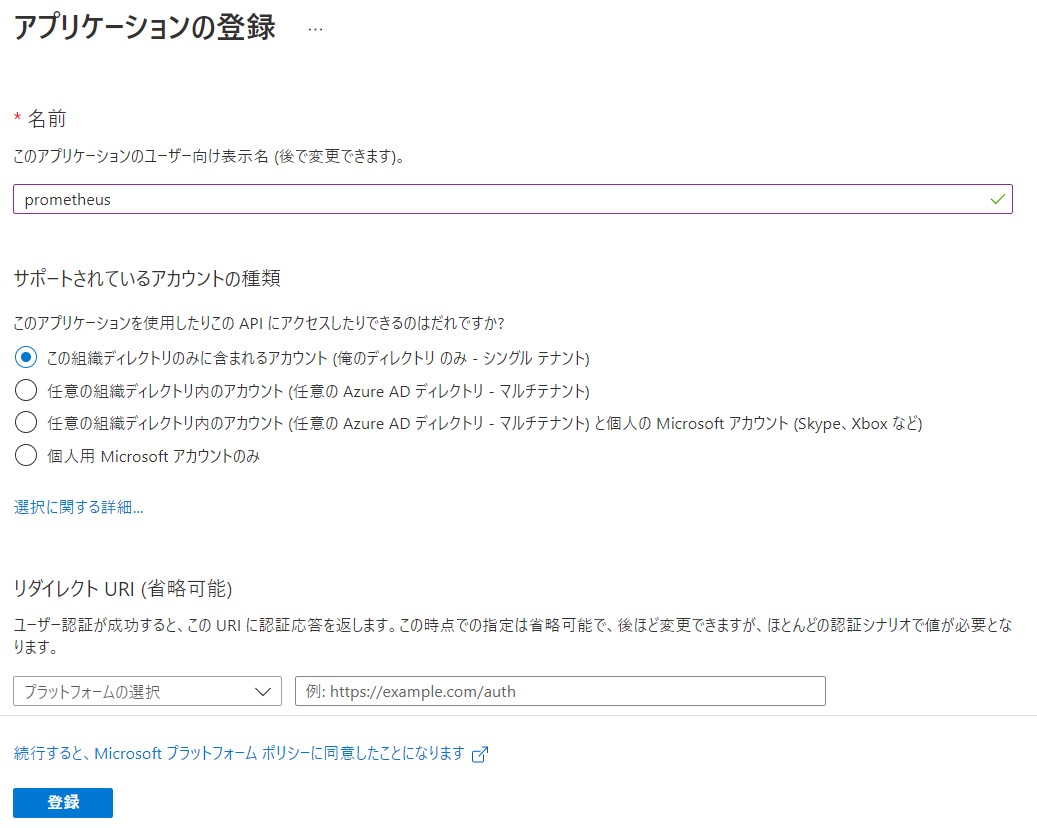
アプリ登録
AzureADからアプリ登録を行います。
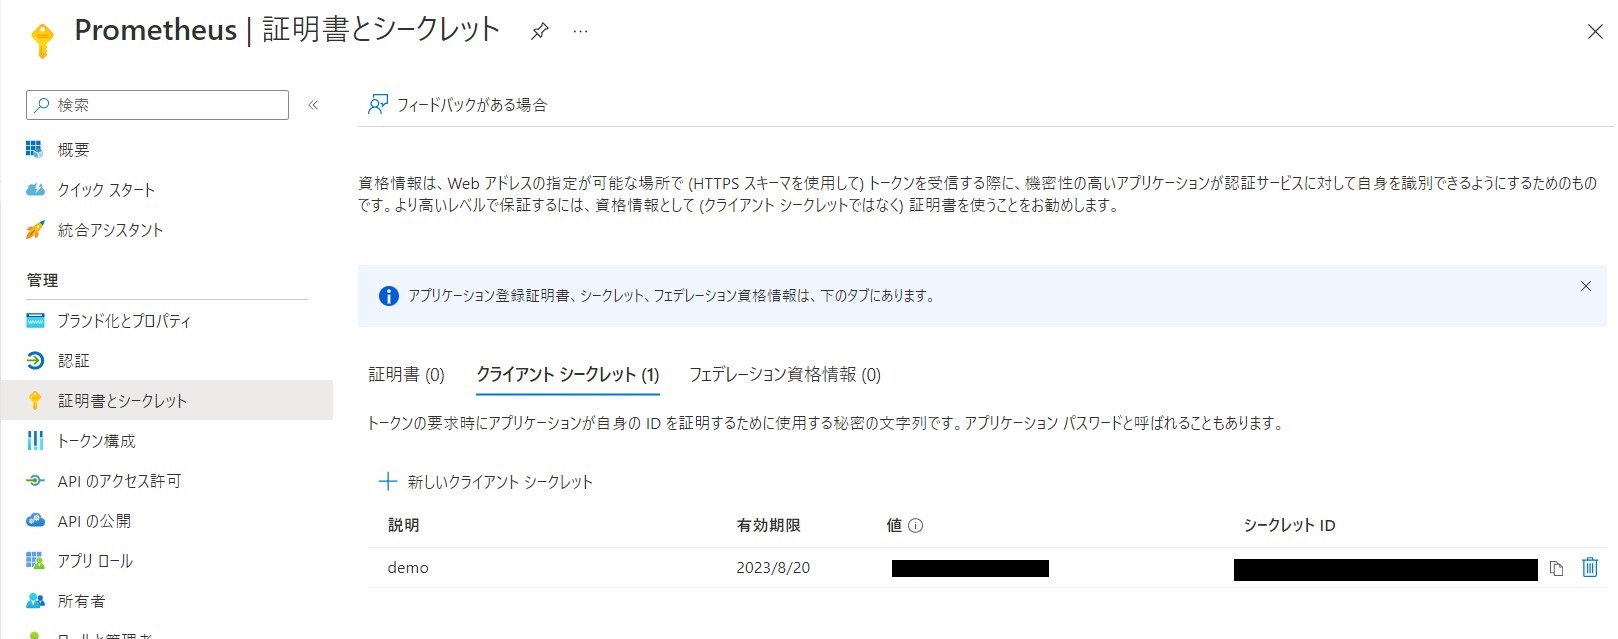
シークレットの作成を行い、値は控えておきます。
クライアントIDとテナントIDも控えておきます。
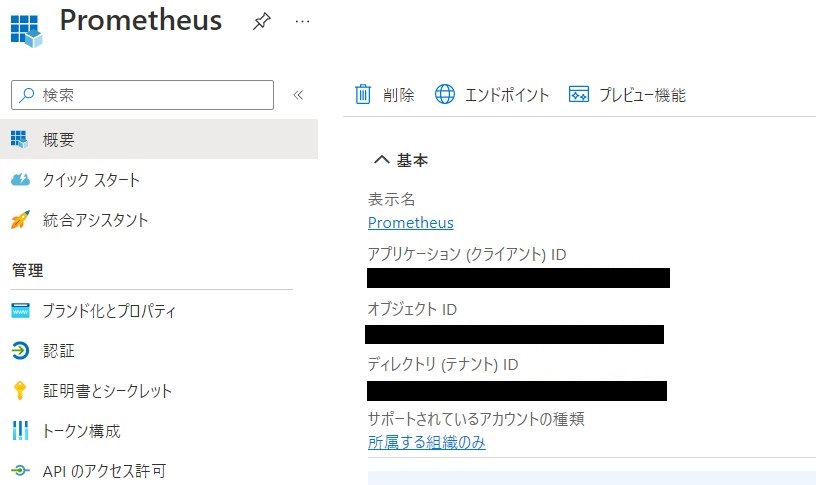
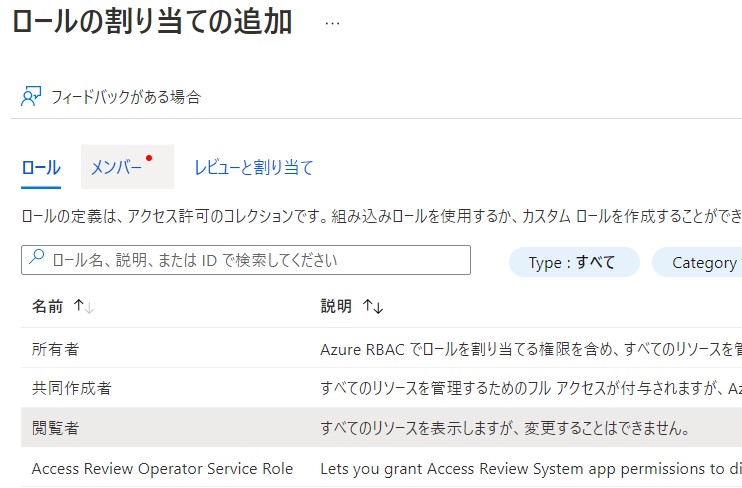
あとはサブスクリプションに対してロールを割り当てます。
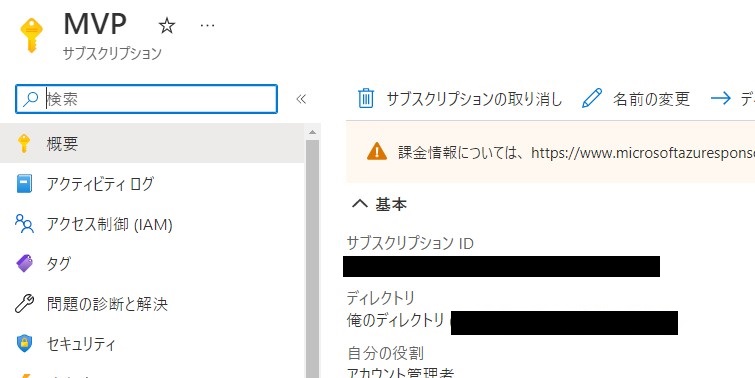
サブスクリプションIDを控えておきます。
Prometheusのインストール
Ubuntu Serverではパッケージでインストールすることも可能です。ただし未病にバージョンが古いです。
apt install prometheus
今回は最新バージョンを利用するため、GitHubよりダウンロードしてきます。

curl -L -O https://github.com/prometheus/prometheus/releases/download/v2.42.0/prometheus-2.42.0.linux-amd64.tar.gz
解凍します。
tar zxvf prometheus-2.42.0.linux-amd64.tar.gz
cd prometheus-2.42.0.linux-amd64
とりあえず起動できるか確認します。
./prometheus
起動を確認したら、ctrl+c で一度停止します。
prometheus.ymlの編集
prometheus.yml を編集します。static_configsをコメントアウトして、azure_sd_configs を編集します。上記で控えたそれぞれのIDを入力します。リソースグループは、省略できます。ないとサービスプリンシパルのRBACの適用範囲(ここではサブスクリプション)の範囲で仮想マシンを検出してしまいます。避けるためにリソースグループを指定します。
# my global config
global:
  scrape_interval: 15s # Set the scrape interval to every 15 seconds. Default is every 1 minute.
  evaluation_interval: 15s # Evaluate rules every 15 seconds. The default is every 1 minute.
  # scrape_timeout is set to the global default (10s).

# Alertmanager configuration
alerting:
  alertmanagers:
    - static_configs:
        - targets:
          # - alertmanager:9093

# Load rules once and periodically evaluate them according to the global 'evaluation_interval'.
rule_files:
  # - "first_rules.yml"
  # - "second_rules.yml"

# A scrape configuration containing exactly one endpoint to scrape:
# Here it's Prometheus itself.
scrape_configs:
  # The job name is added as a label `job=<job_name>` to any timeseries scraped from this config.
  - job_name: "prometheus"

    # metrics_path defaults to '/metrics'
    # scheme defaults to 'http'.

    #static_configs:
    #  - targets: ["localhost:9090"]

    azure_sd_configs:
      - subscription_id: xxxxxxxxxxxxxxxxxxxxxxxxxxxxxxxxxxx
        tenant_id: xxxxxxxxxxxxxxxxxxxxxxxxxxxxxxxxxxx
        client_id: xxxxxxxxxxxxxxxxxxxxxxxxxxxxxxxxxxx
        client_secret: xxxxxxxxxxxxxxxxxxxxxxxxxxxxxxxxxxx
        resource_group: <リソースグループ名>
        port: 9100
編集後にprometheusを起動しておきます。
node_exporterのインストール
node_exporterはパッケージでもインストール可能です。
apt install prometheus-node-exporter
最新バージョンを利用するためGitHubからダウンロードしてきます。

curl -L -O https://github.com/prometheus/node_exporter/releases/download/v1.5.0/node_exporter-1.5.0.linux-amd64.tar.gz
解凍します。
tar zxvf node_exporter-1.5.0.linux-amd64.tar.gz
cd node_exporter-1.5.0.linux-amd64
起動します。
./node_exporter
動作を確認していきます。
動作確認
動作を確認するには同じprometheusと同じセグメントが楽です。今回はWindows serverを用意して確認しています。
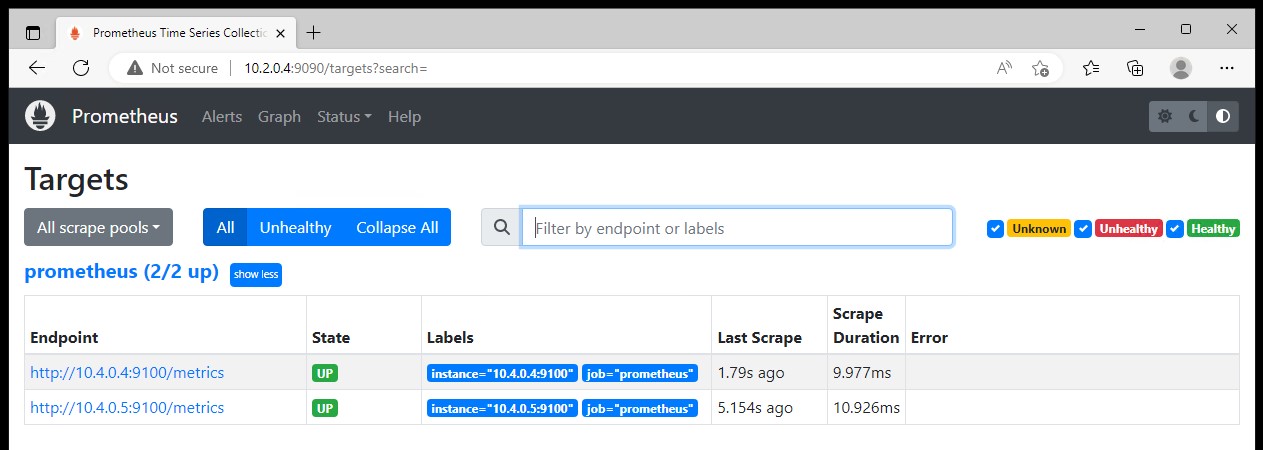
最初にターゲットを確認してみます。
node_exporter を起動している仮想マシンが検出されていることがわかります。
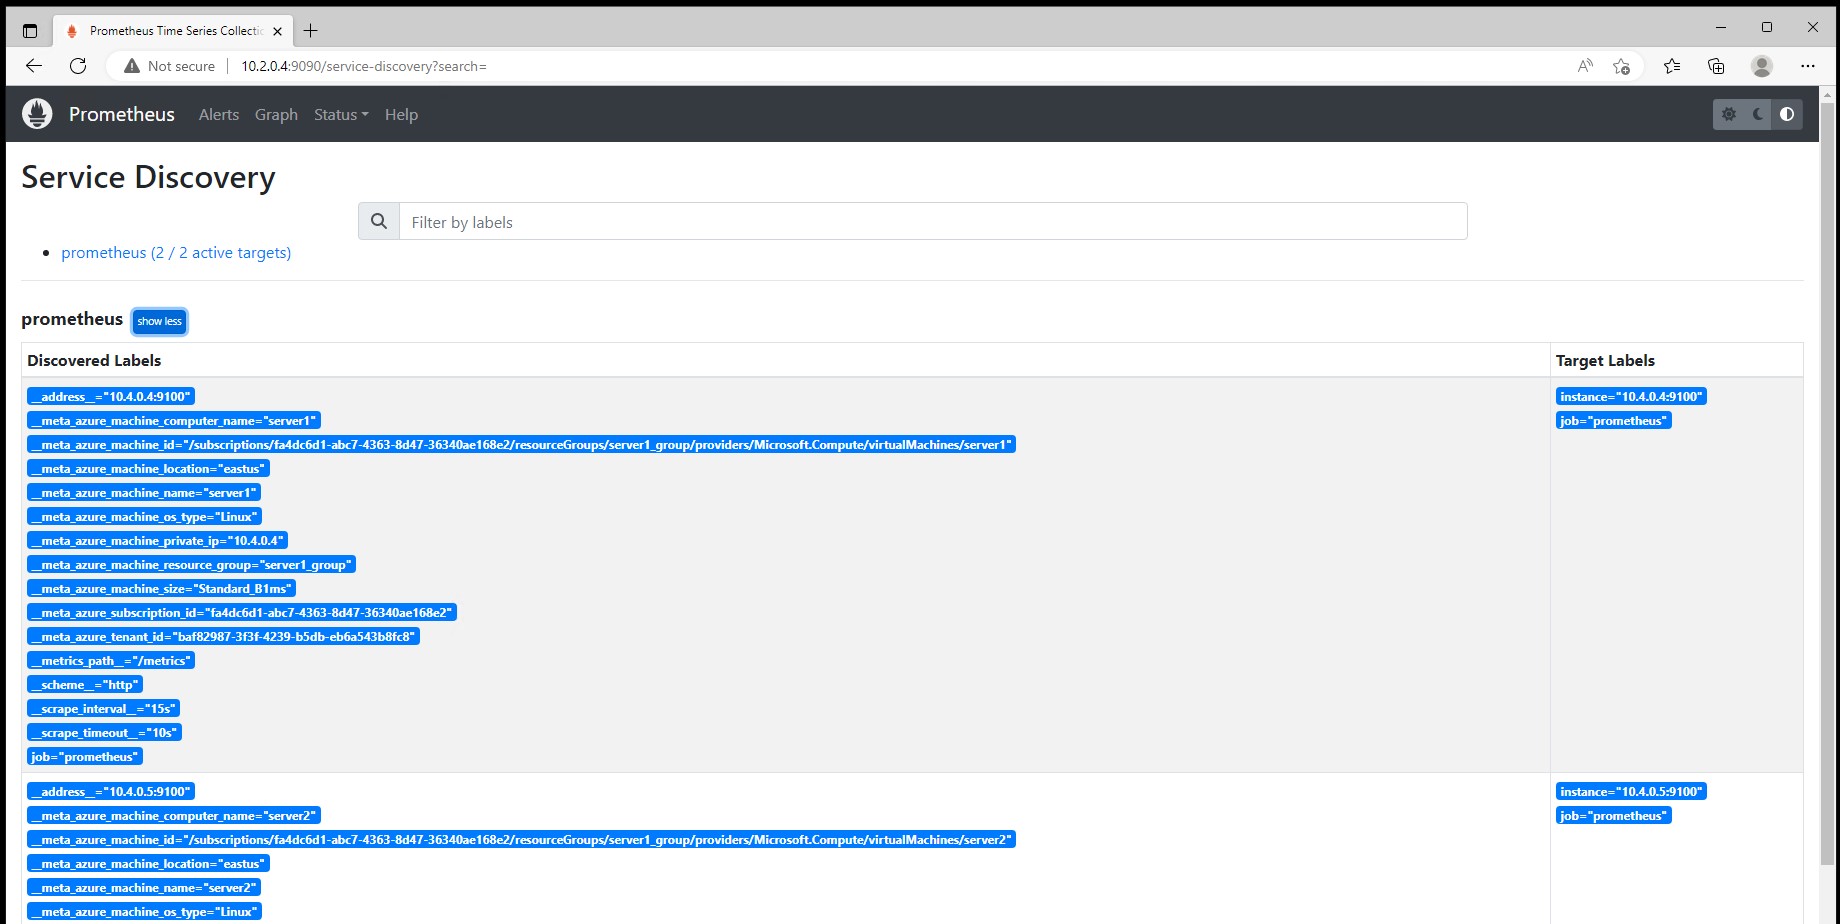
Service Discoveryを確認するとメタデータが確認できます。
以上にようにAzure仮想マシンでPrometheusを有効に活用できます。
まとめ
Prometheus はAzureでも連携してくれます。今後も、Prometheus 用のAzure Monitorが出てきているなど着々とCloud Nativeを意識したサービスがAzureでも増えるでしょう。